General
The Case for Comps (Part 2)
First published: Aug 21, 2026 · Last updated: Aug 23, 2026
In Part 1 of this series, we discussed how doing some comparison shopping for investments is a good idea.
We did quite a bit of hand-waving in Part 1, and realized that what we really should do is present a concrete example. So with that in mind, let's do some science: form a hypothesis, test it, and see if it holds up. Don't worry, no complex math or anything difficult is involved in this experiment - FundQuant makes this easy.
Here's the hypothesis:
Expensive funds will not be able to consistently beat their lower cost comparable funds.
We could get more exact and define by how much, over what period, etc. - but for this experiment, we'll keep our hypothesis directional in nature.
First we need to decide on the definition of an expensive fund, and how to narrow down the list to a fairly small number. We decided to consider both ETF's and Mutual Funds that have at least 10 years of history. We then decided that expensive would be defined as any fund with an expense ratio from 2-3%. Our last criteria is to limit the list by the top 10 funds by assets under management. This means that we'll find expensive funds that have been able to attract quite a few assets.
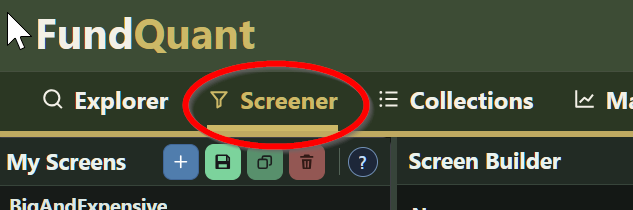 So how do we find these funds? The FundQuant screener! Feel free to follow along if you want by navigating to the FundQuant Screener in a new browser tab. To save your screen, sign up for a FundQuant account - it's free. That will give you the ability to save this screen, and as many others as you'd like.
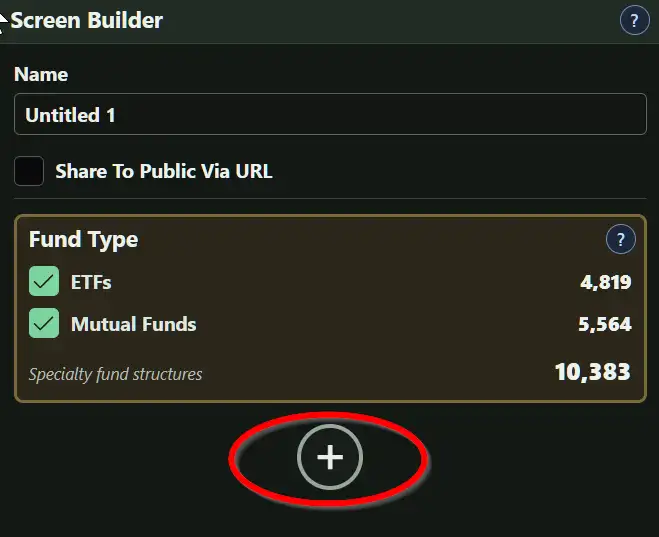 In the screener, click on the + button to add filter criteria. In our experiment, we add market history, expense ratio (twice), and size (AUM).
You can add as many criteria as you'd like, and you can move filter blocks up and down if you ever want to change filtering order. The number of funds that pass each step automatically computes so you can see what's happening at each step.
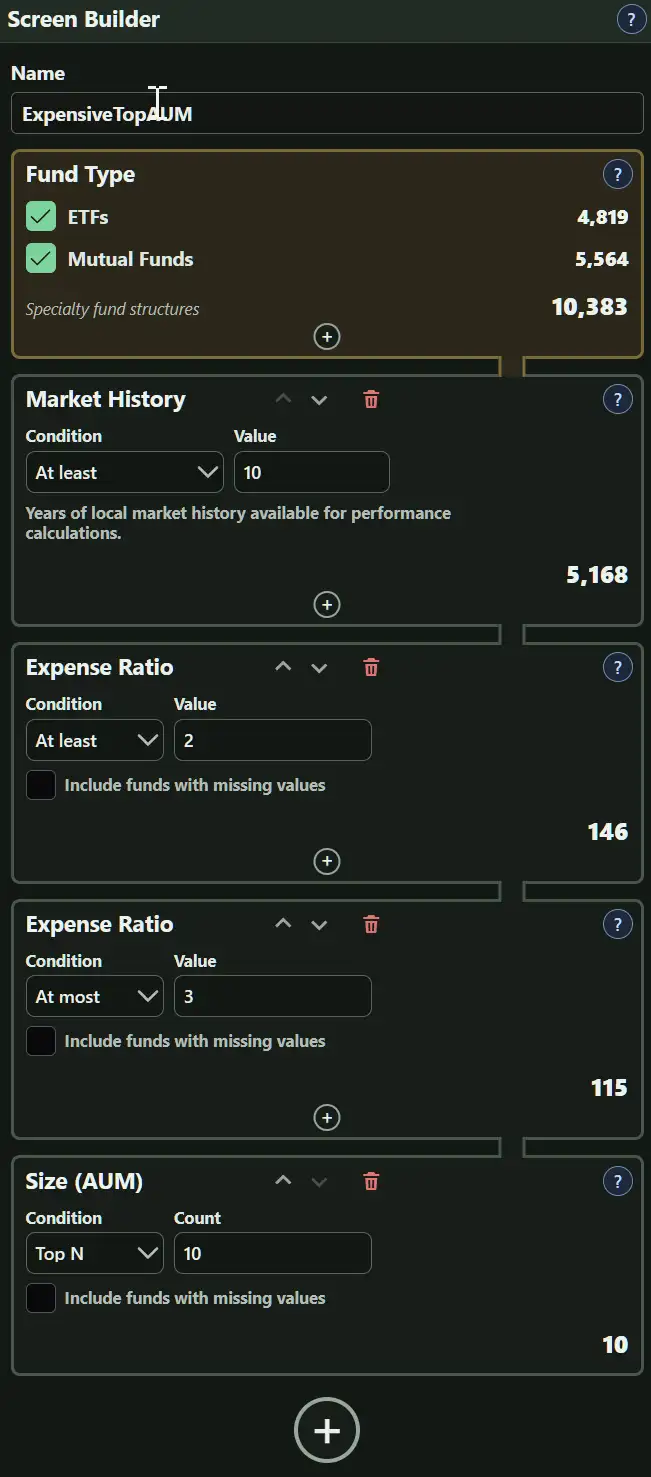 We see that 5,168 funds have at least 10 years of history. We also see that an expense ratio of 2% or more reduces the number of funds down to just 146.
By limiting expenses to between 2% and 3%, we further limit the fund fund count down to 115.
And lastly, we just keep the top 10 funds by top assets under management. As you run your own experiments, it's easy to add other criteria that will allow you to screen for exactly what you're looking for.
To the right of the screen definition, you will see funds that meet all the filter criteria. You can pick which columns are shown in the screen results if you want to further compare things like performance, etc in the results table. For now, the defaults are fine, so we just save this screen.
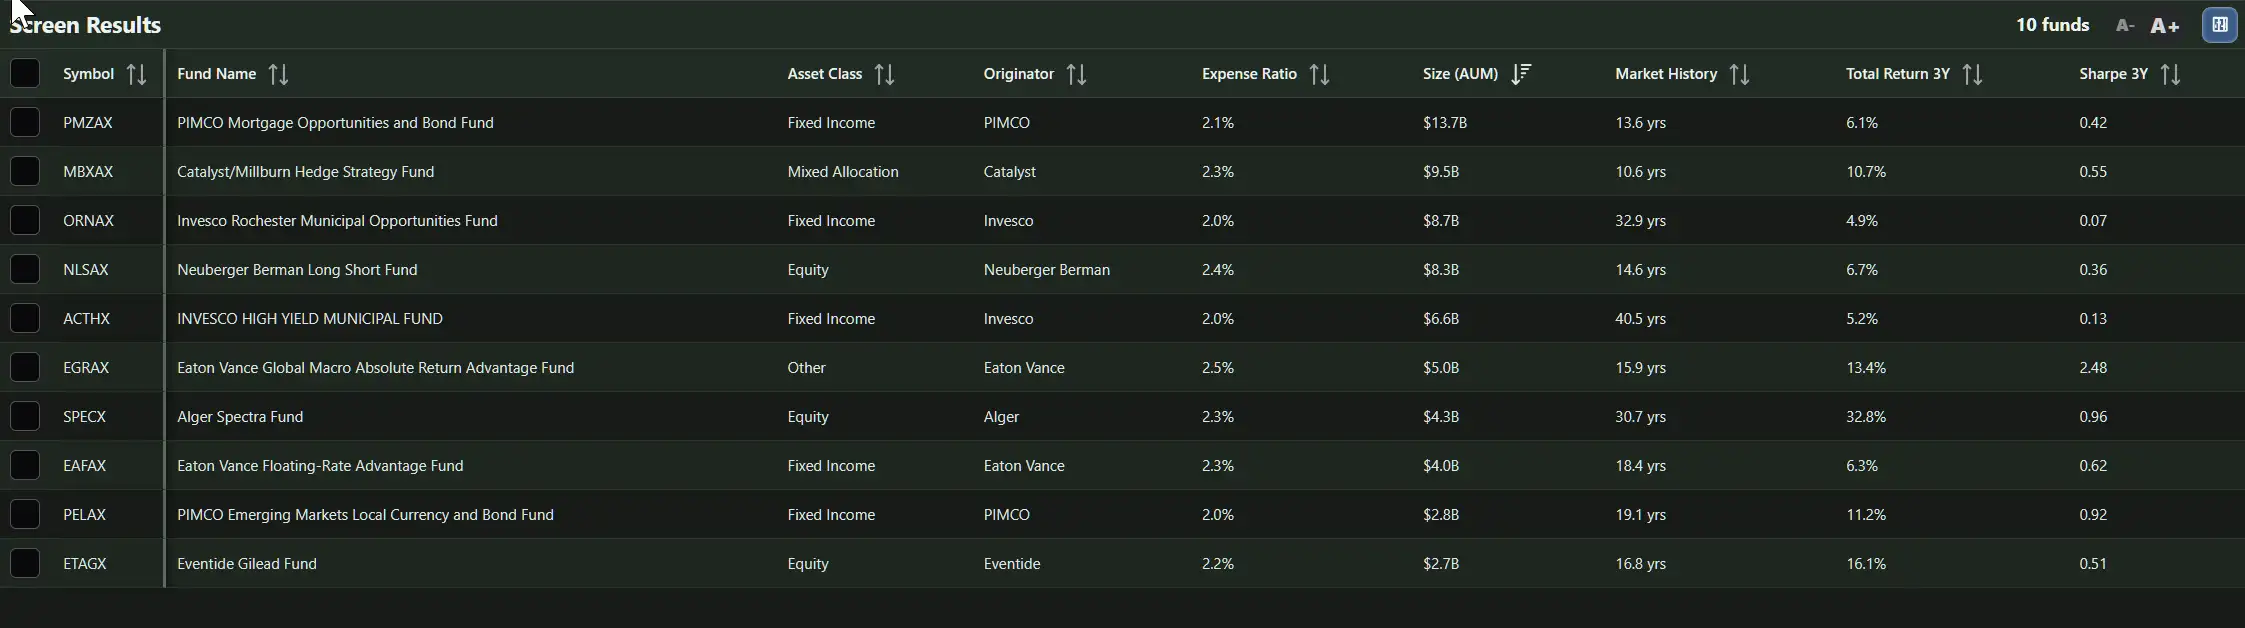
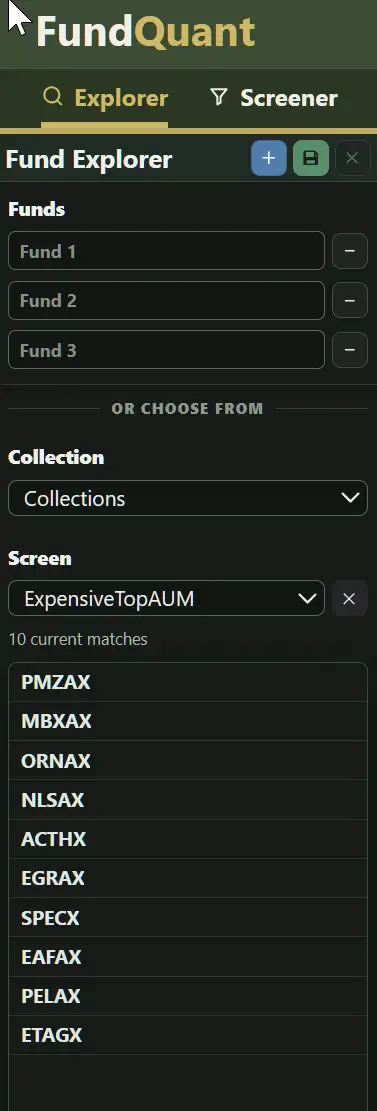 We now have a list of funds, and we want to look at comps for each. Now we go to the Fund Explorer, and pick the Screen that we just created. As expected, we see each of our expensive funds listed. Pick the first fund, and in the main explorer area choose the "Comps" tab. After a brief pause for computing comps, FundQuant comes back with funds that meet required criteria to be considered comparable.
When looking at comparable funds, we typically see 3 candidates. Let's look at an example for ACTHX.
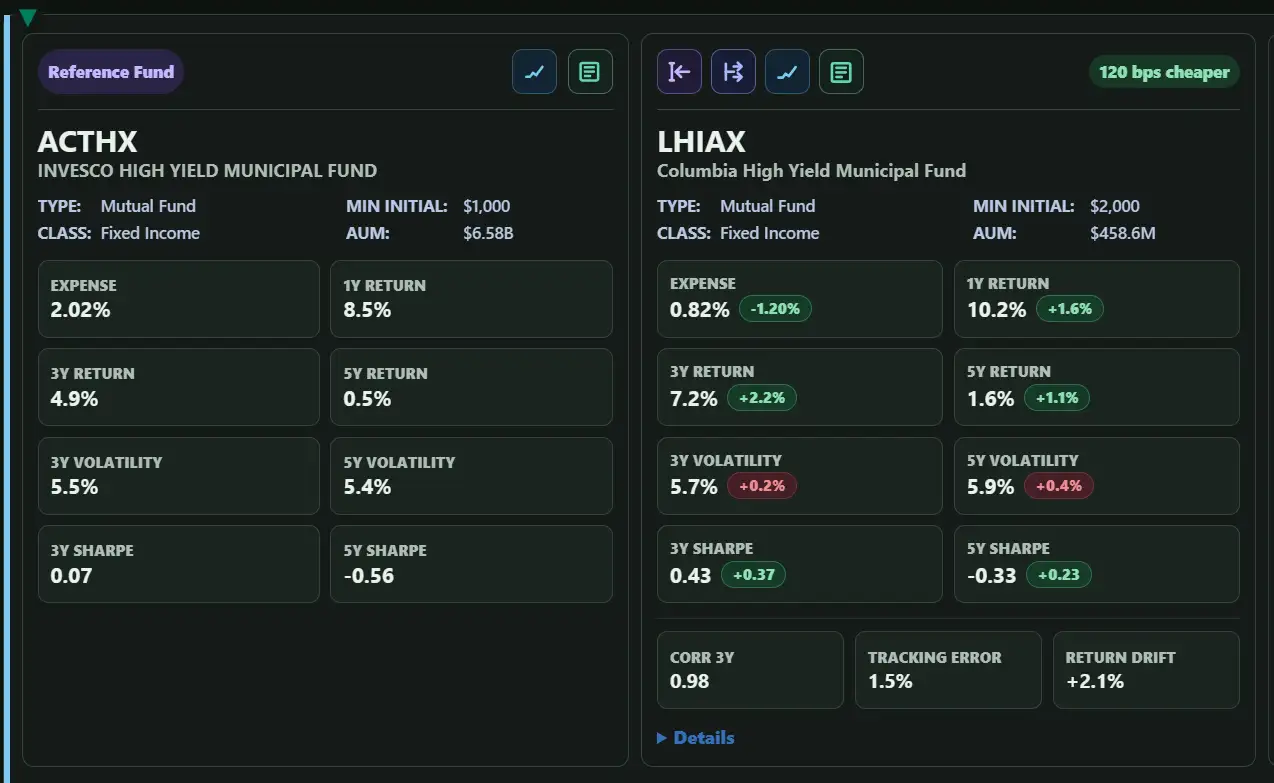
ACTHX is a fund that has over $6B in assets - not a small fund. It happens to be a high-yield municipal bond fund with modest returns, and charges 2% in fees. This feels high to us. And indeed we see some comparable funds that have lower expense ratios, and also show improved returns. For example LHIAX is a high-yield municipal bond fund that has an expense ratio about 1.2% lower. And sure enough, returns tend to be higher. When looking at the 5 year annualized returns, LHIAX is about 1% higher. We find it interesting that the improved return was so close to the difference in fund expense. So the question becomes: are you getting what you expect for that extra expense?
In the case of expensive funds, it pretty typical to see comps with lower expense ratios that have higher returns. Let's look at one more example: PMZAX. In this case, PONAX has a lower expense ratio, and has a favorable 3 year return. Does this automatically mean that PONAX is "better"? This is where your own judgment has to come into the picture. Now you are armed with more information: would you go with PMZAX, or would you pick a lower cost fund that has higher returns?
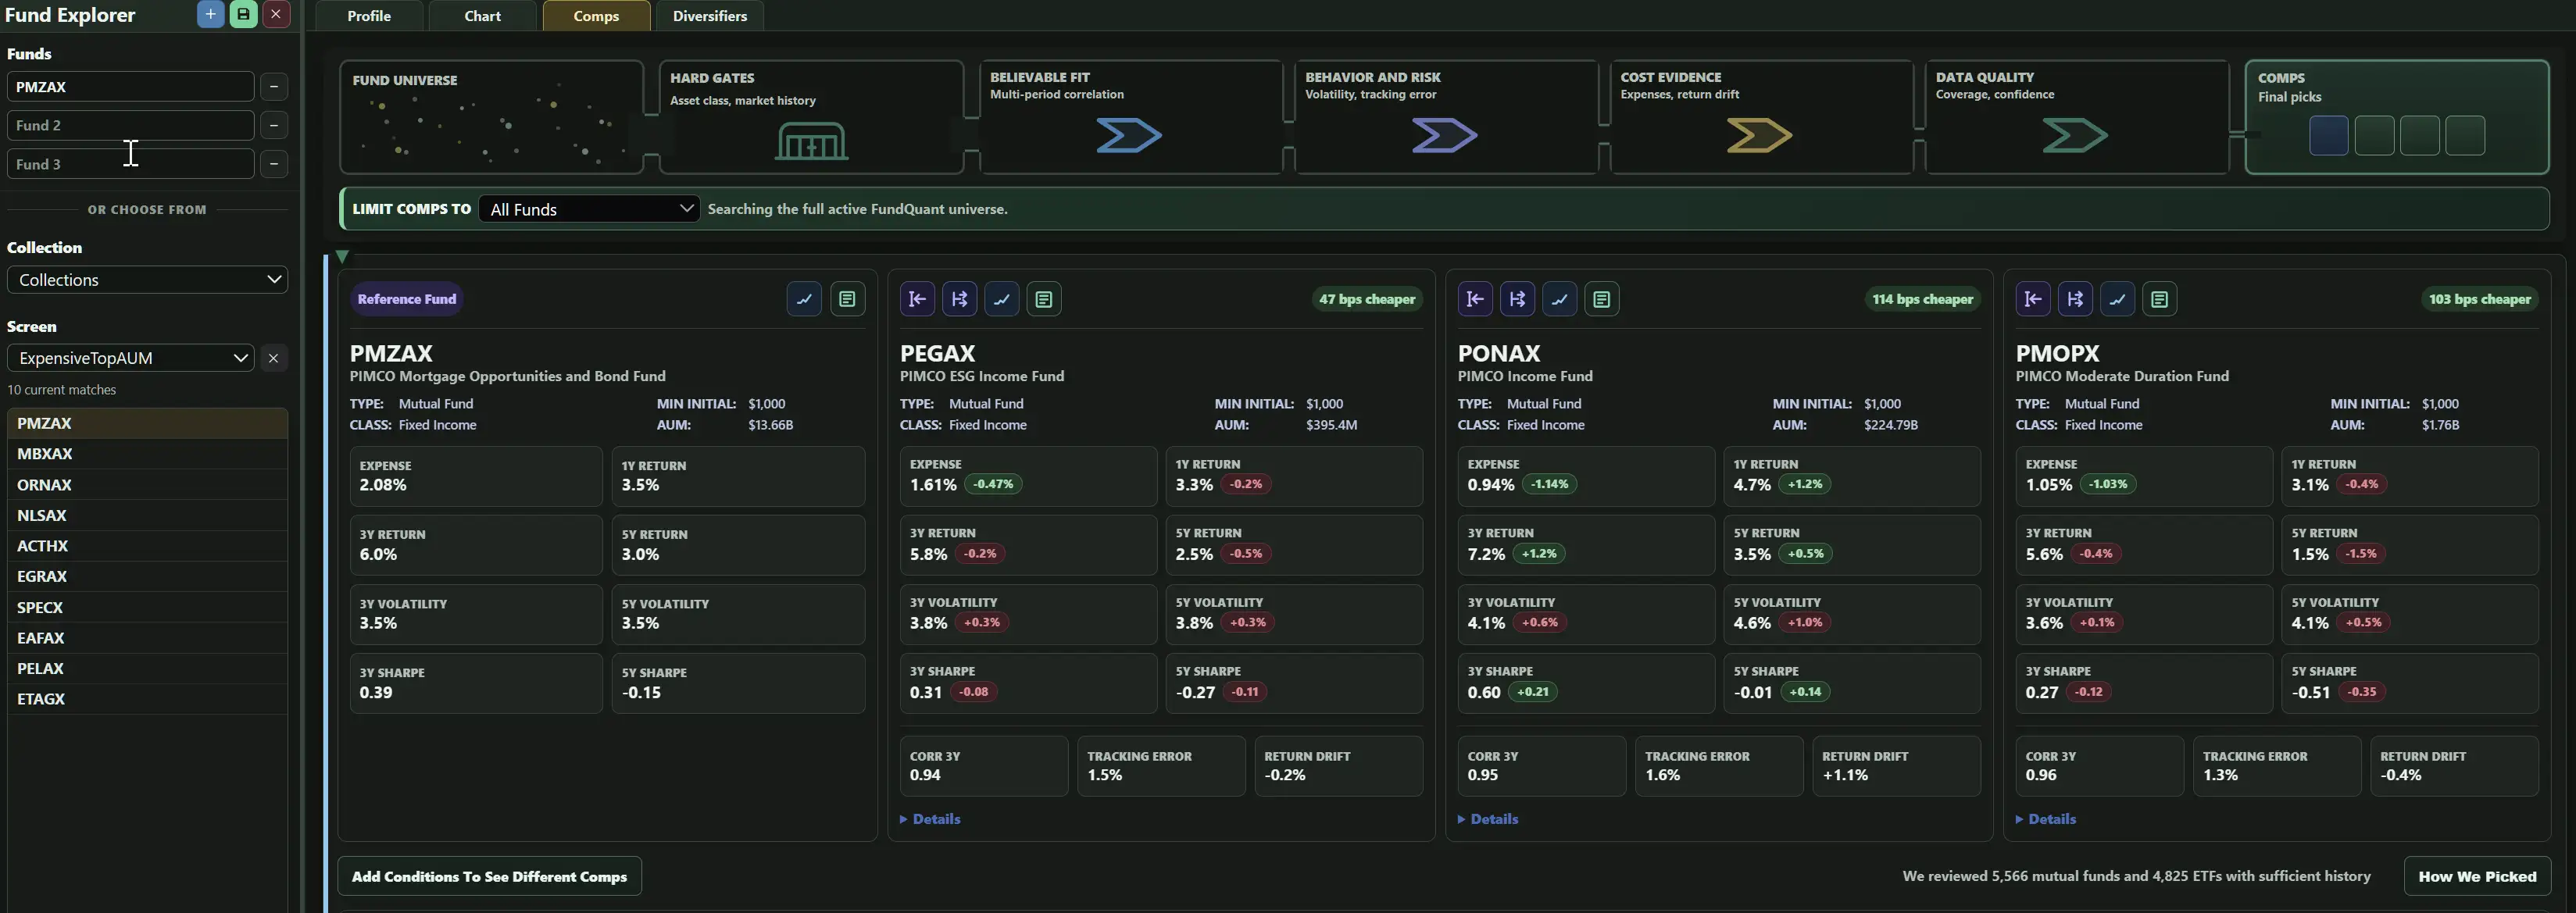
To look at comps for all 10 funds, you can select every fund, or you can clear the Funds list in the Explorer and look at them one at a time. For our experiment we simply selected all funds so we could look at comps one at a time.
So what did we learn?
- For the 10 funds, 9 had comps that met FundQuant criteria.
- For those 9 funds, 8 had 3 comps (1 fund had just one comp).
- For the 8 funds, 7 had at least one comp with a lower expense ratio that also had higher total returns and improved risk adjusted returns.
Conclusions
This was a limited experiment, but it clearly showed that many funds with high expenses have comparable funds with lower expenses and improved returns - arguably because they don't have the same drag of those high expenses.
Our hypothesis of expensive funds not consistently beating lower cost alternatives was confirmed.
This experiment illustrated that low cost funds can frequently out-perform (spoiler alert: we've ran hundreds of comps across numerous funds in all asset classes - we see this pattern over and over).
To us, this reenforces that fact that comparison shopping is well worth the time. In only takes a few minutes, it's free, and it arms us with additional information that leads to informed decision making.
Take some time and run some experiments yourself - especially for funds you're considering or that you currently hold. You may find that what you own already do extremely well compared to other similar funds. Or you may find that you want to think about possible options once you see what's out there!